May 20, 2024

Securing affordable primary care for all Australians

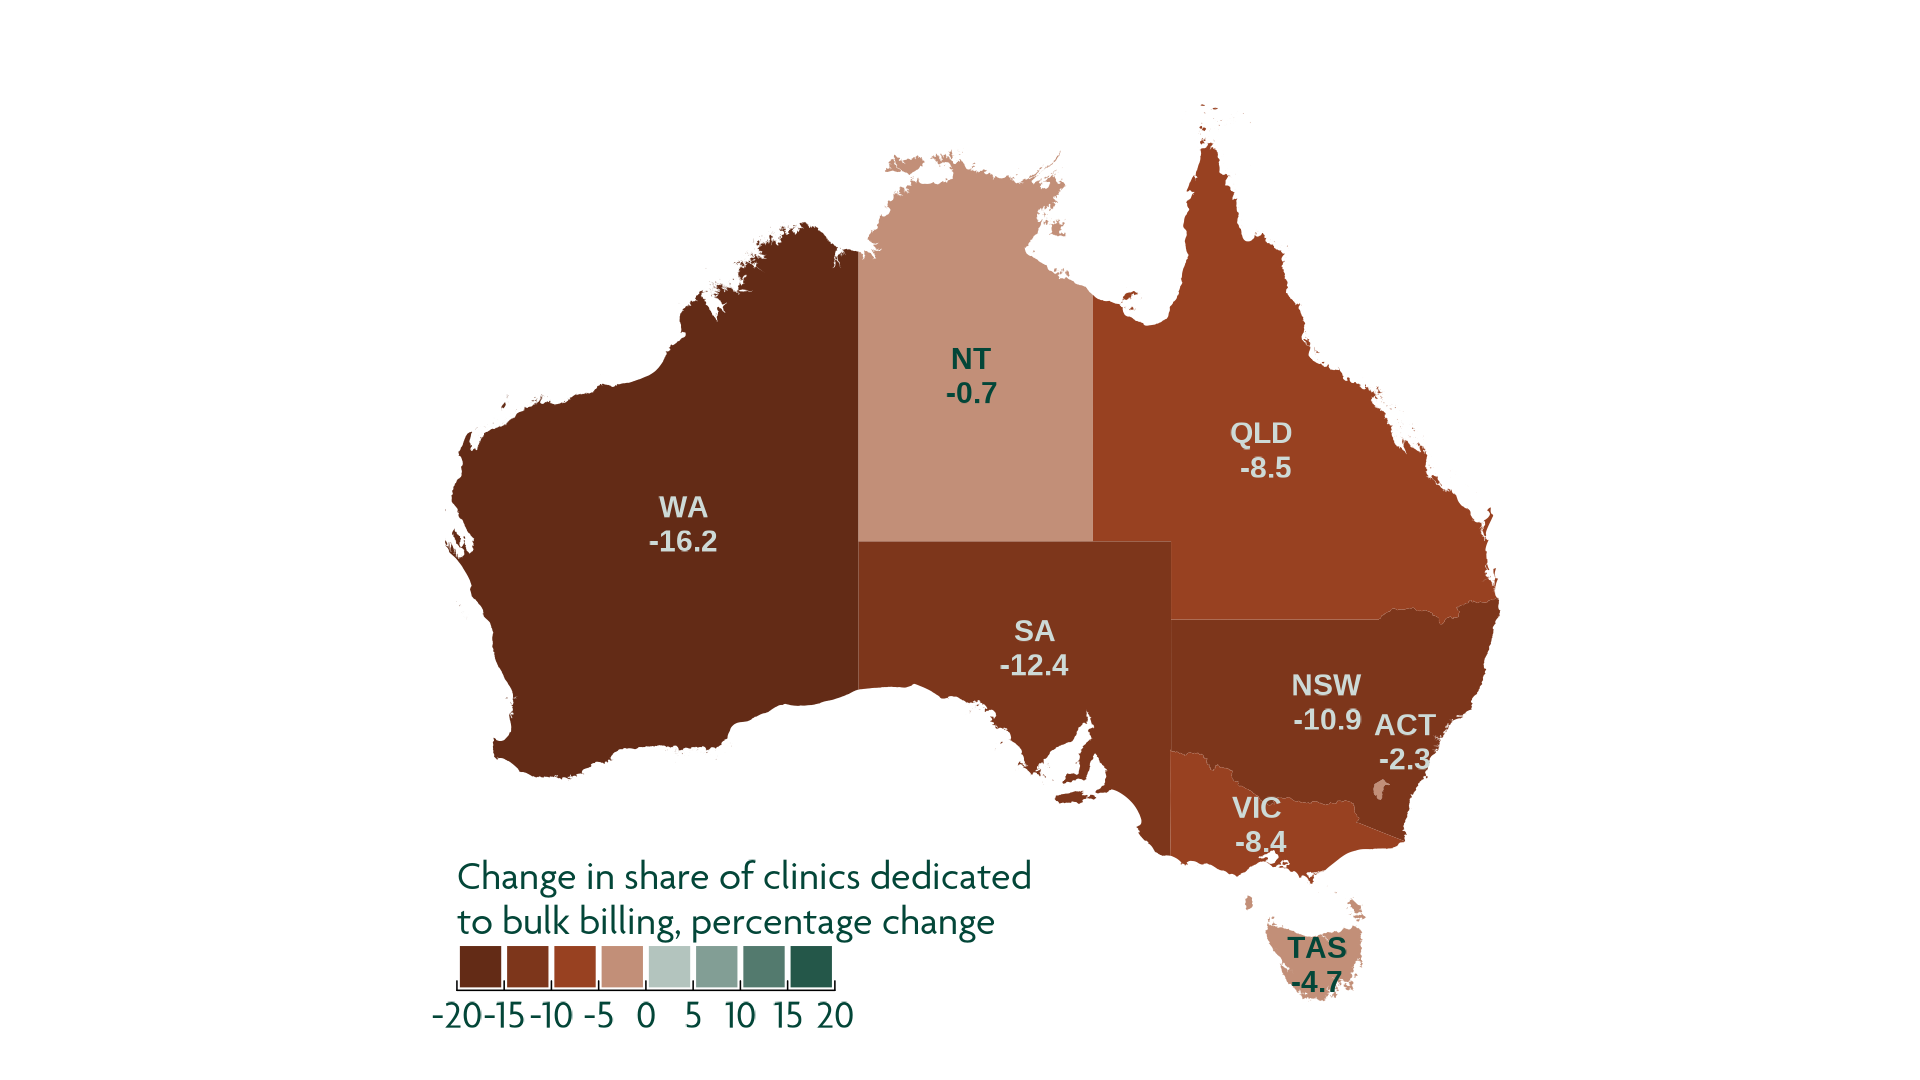
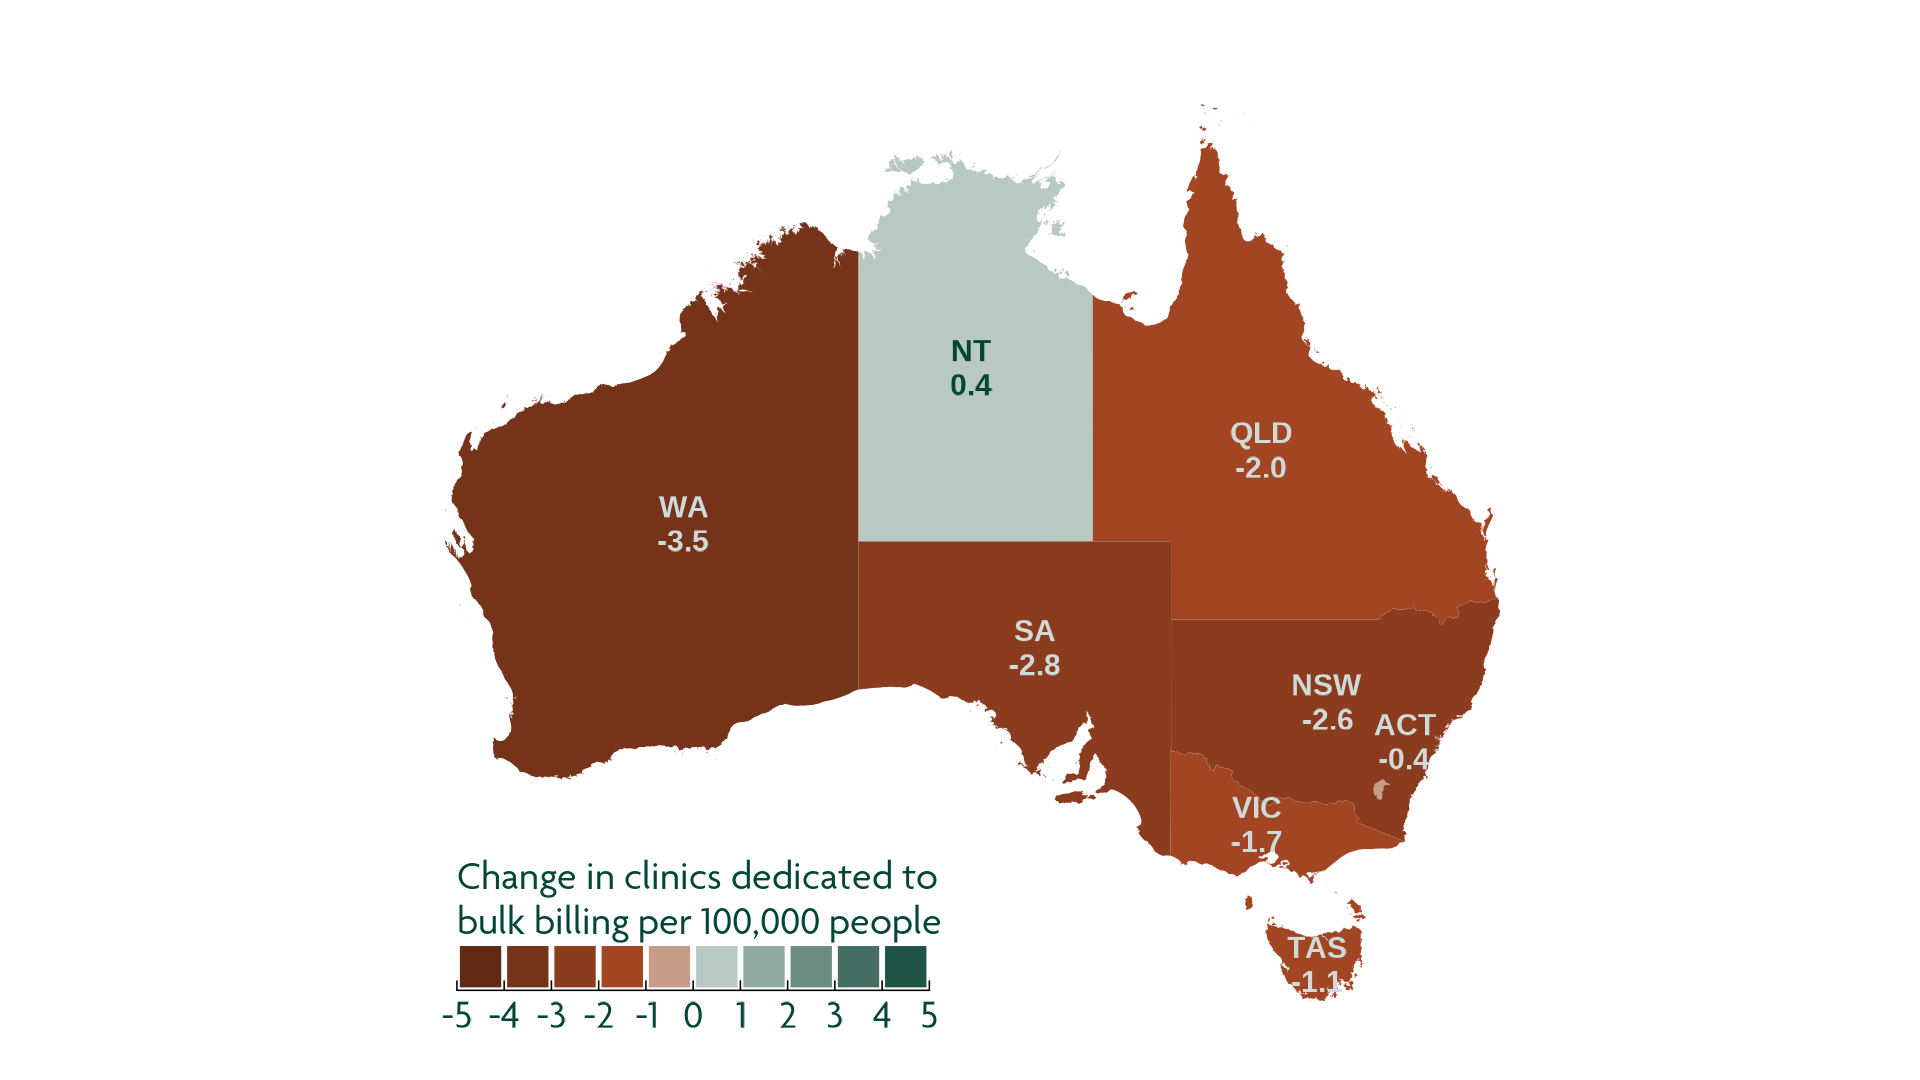
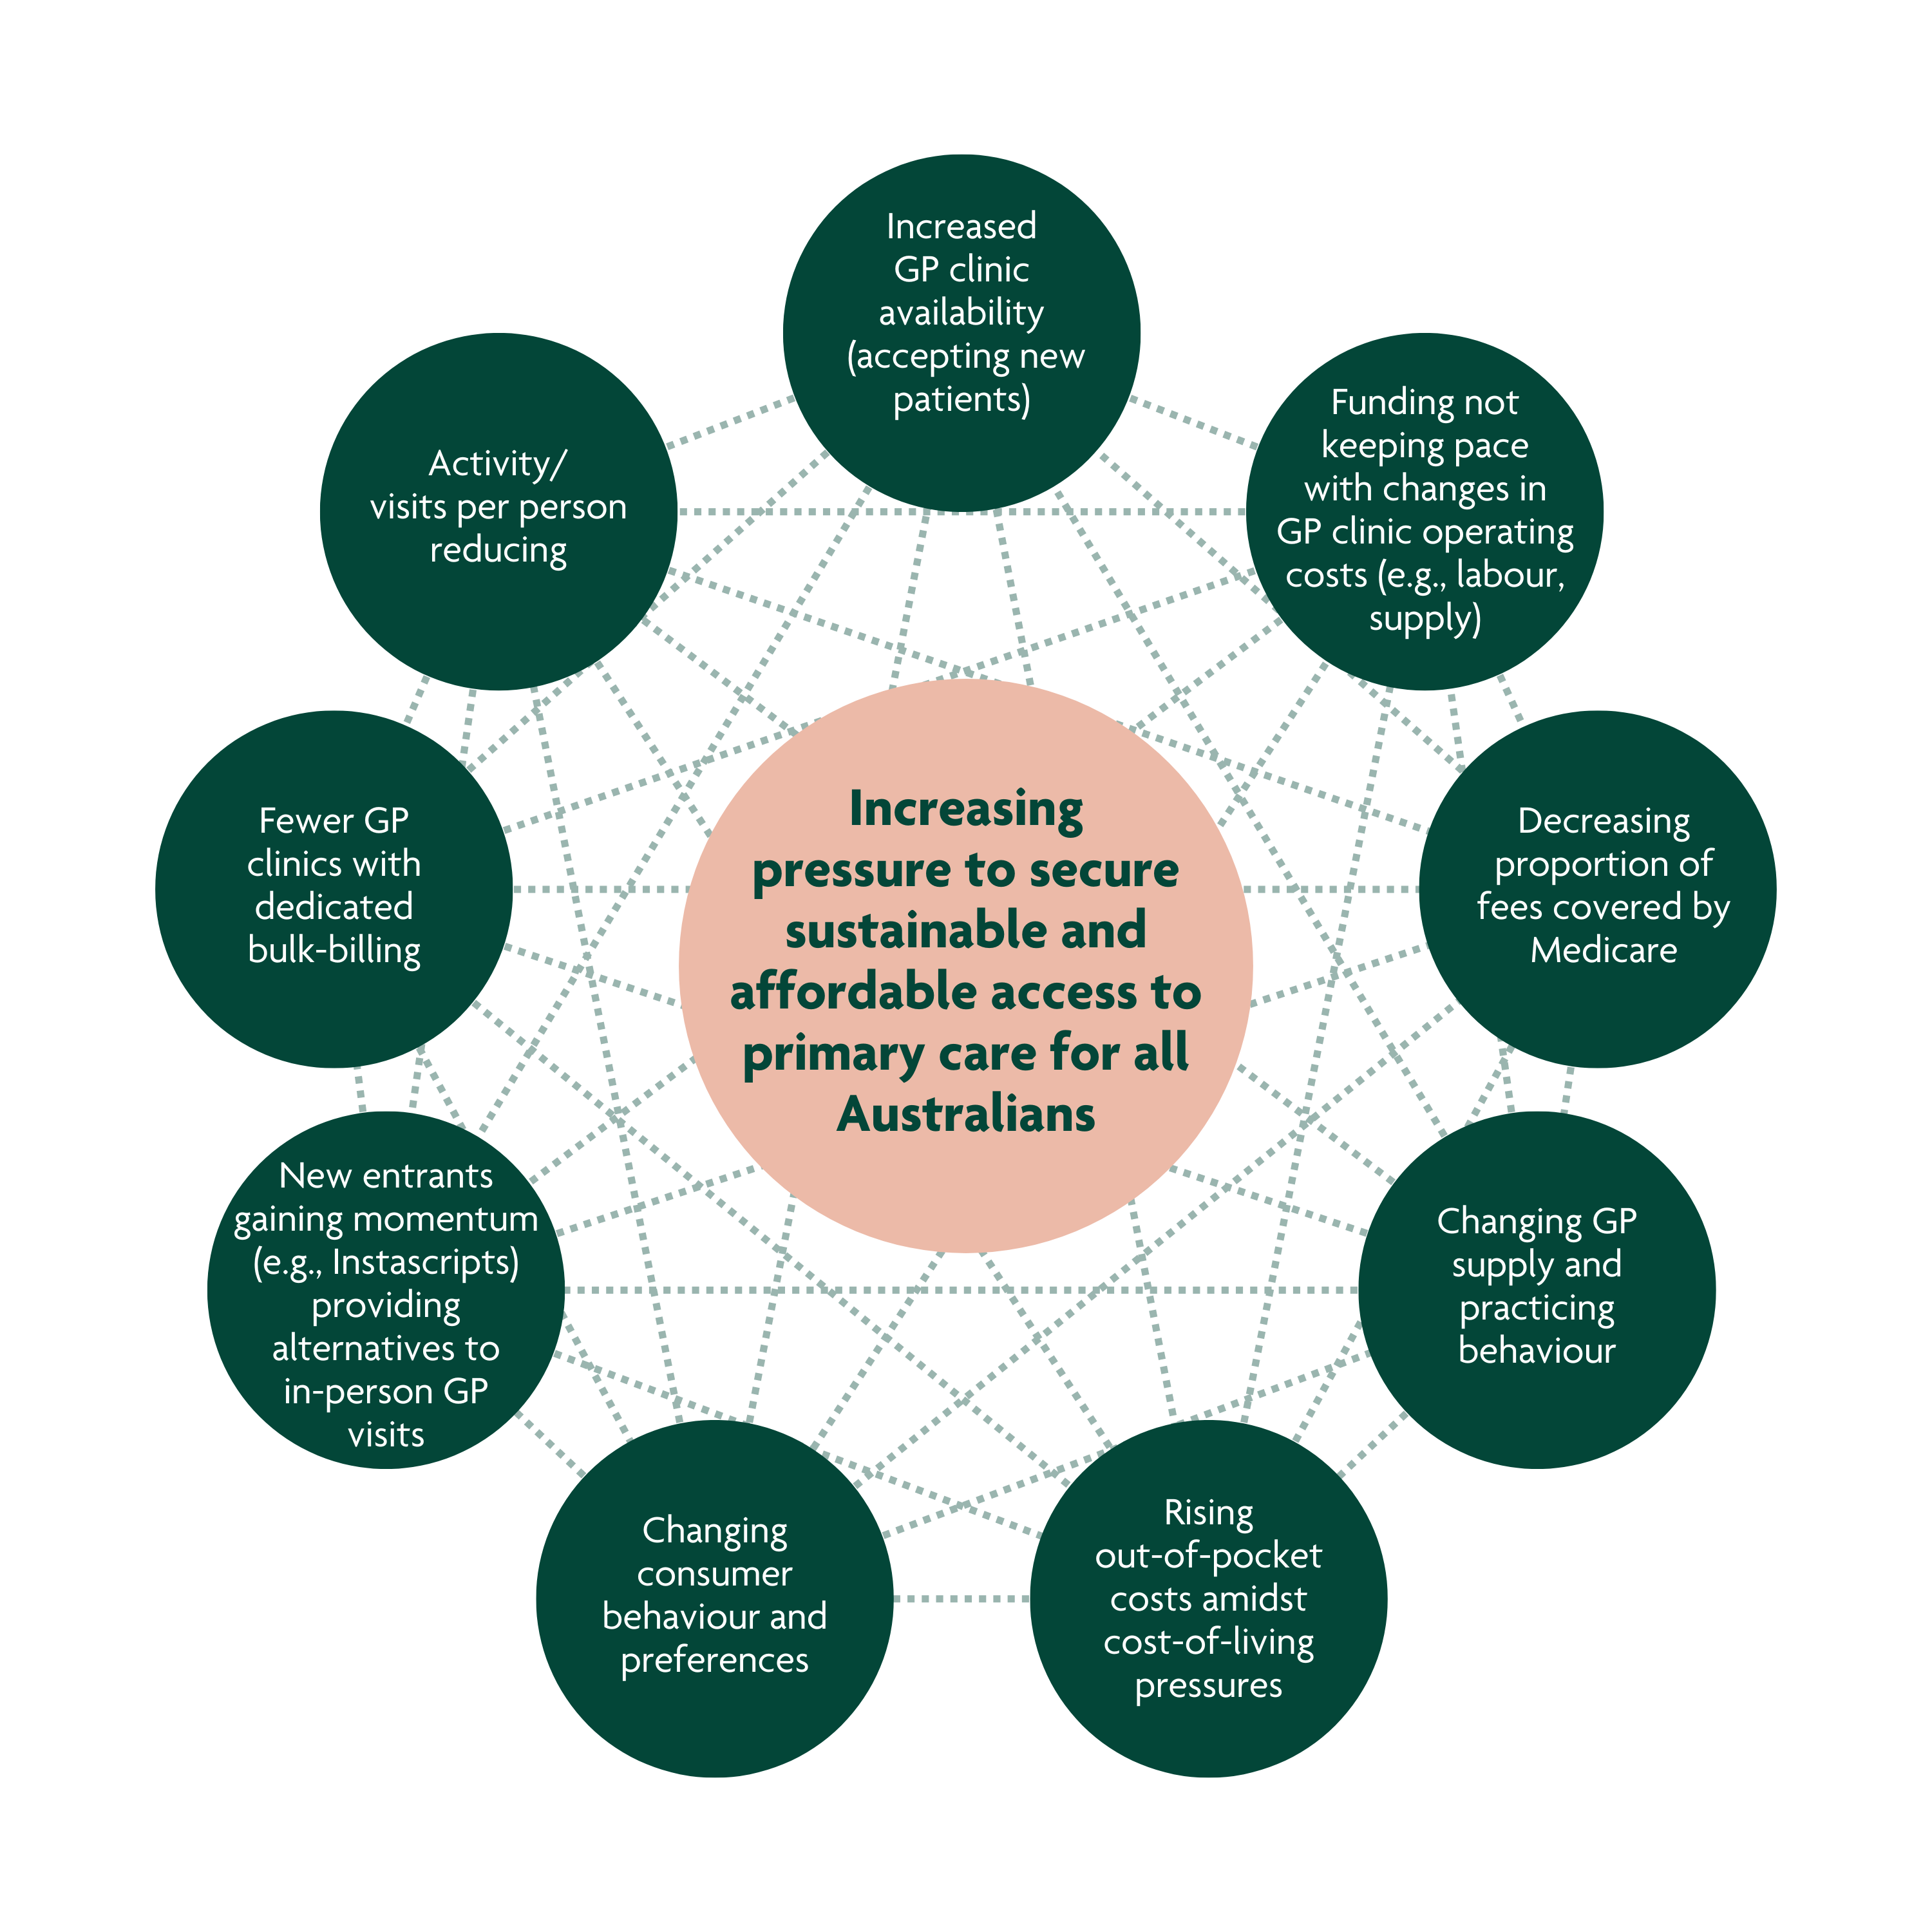
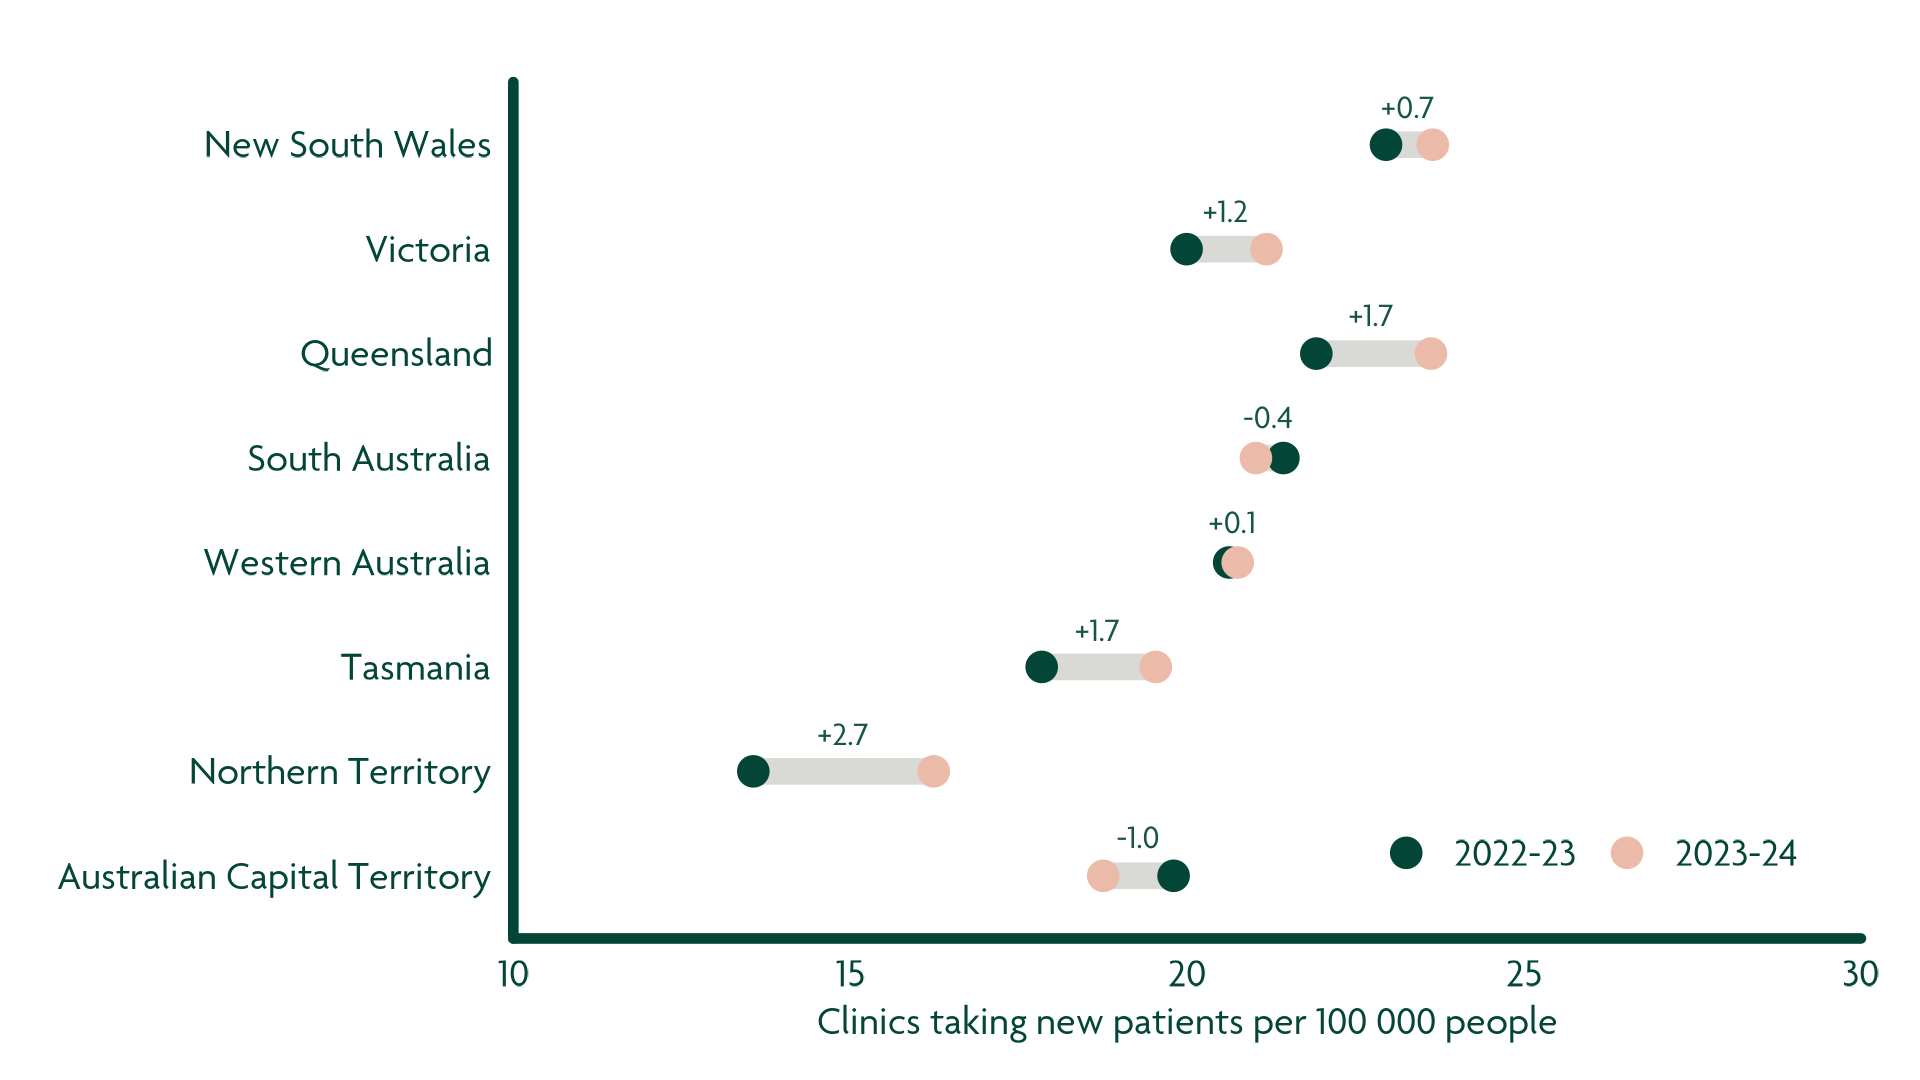
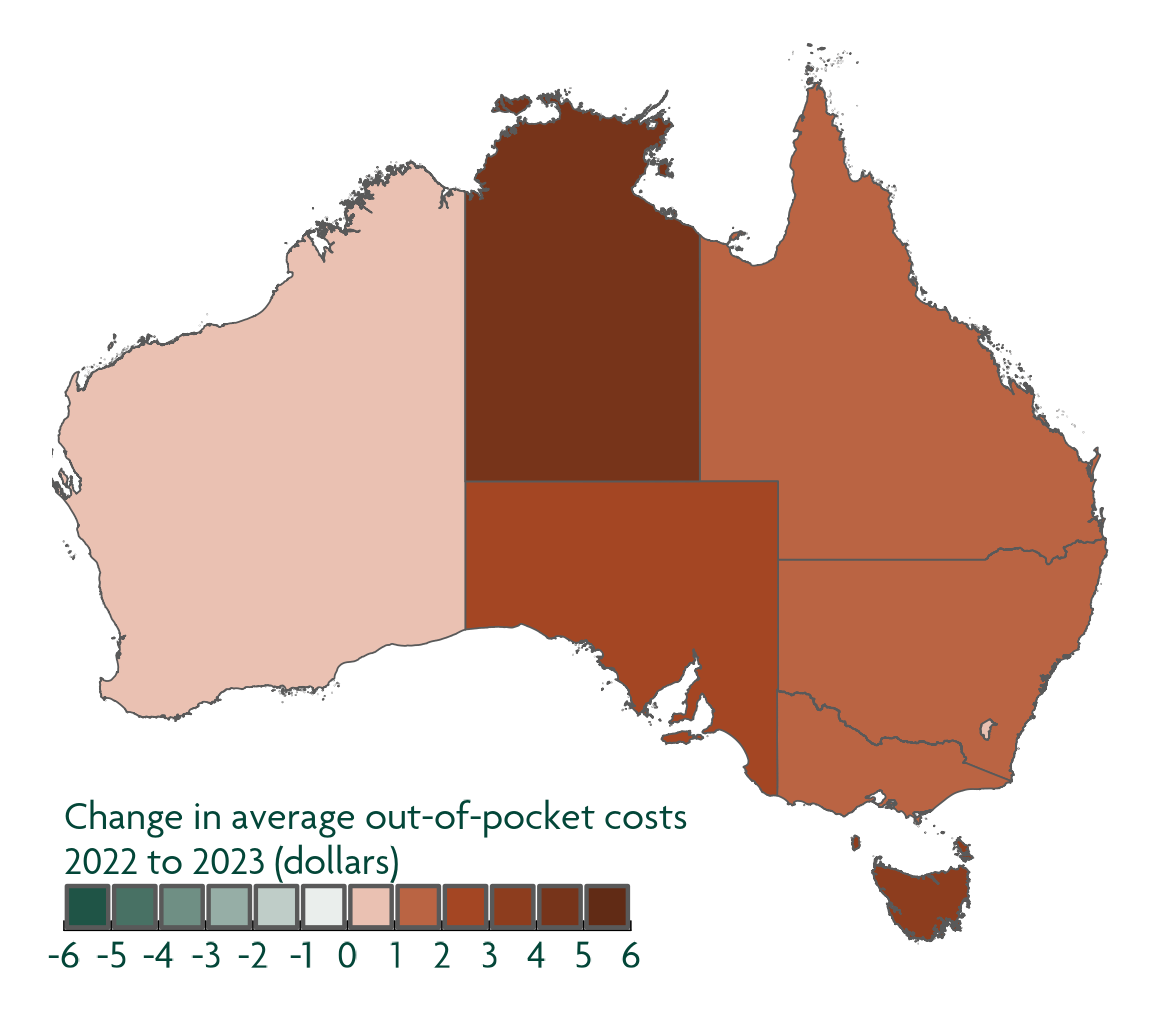
Amidst growing cost-of-living pressures, the number of GP clinics bulk billing standard non-concession adult consultations has decreased. In this article, we unpack some of the factors likely contributing to the decrease and explore some of the potential access implications. We hope this will spark curiosity and encourage a conversation about how to ensure that access to primary care remains affordable into the future for all Australians.

Written by
In collaboration with

There has been a 28% decrease in the number of GP clinics bulk billing standard consultations from 2022-23 to 2023-24.

It has been well documented over the past several months that more Australians are having difficulty finding a local general practitioner (GP) clinic that bulk bills for standard consultations (MBS Item 23) and long consultations (MBS Item 36). Data collected by Cleanbill – a free healthcare directory dedicated to increasing healthcare accessibility – provides an understanding of where and to what extent this is occurring for non-concession adults.

In short, the number of GP clinics bulk billing non-concession adult standard consultations (MBS Item 23) has decreased, but why? As many Australians struggle to meet the ongoing cost of living pressures, we are curious to unpack what might be contributing to the shift in bulk billing and who has been impacted.

Exhibit 1. Change in GP clinics bulk billing standard consultations, by State / Territory (From ’22-’23 to ’23-’24)


552 fewer GP clinics are bulk billing all non-concession adult standard consultations (Item 23)

Change (%), not adjusted for population change
Change (#) per 100,000 population
 
Source: Cube Group analysis of ABS and Cleanbill data

To unpack this further, we turn our attention to non-concession adult standard consultations (MBS Item 23). We note that this doesn’t cover everything in primary care. For example, similar analysis on non-concession adult long consultations (MBS Item 36) and concession patients may unlock even more valuable insights into positive and negative changes in accessibility of primary care services.

With this in mind, for the purposes of this article, “bulk billing GP clinics” refers to only those clinics identified by Cleanbill with at least one GP bulk billing all non-concession adult patients who attend a standard consultation (MBS Item 23) during regular, weekday business hours. This excludes any clinics that charge a one-off, yearly, or monthly fee to access bulk billing, and does not account for the bulk billing of other services.

What is driving the decrease in the number of GP clinics bulk billing standard consultations?

There are several interconnected factors which reinforce each other. Unpacking these factors and understanding the relationship amongst them is crucial for developing effective strategies to secure Australia’s sustainable and affordable access to primary care into the future.

This article (and Exhibit 2) unpacks some of these factors with the aim of exploring how they are potentially exacerbating or alleviating an access problem, and the implications for Australians, private practices, health services, and policy makers.

Exhibit 2. Multi-variate factors driving the decrease in bulk billing GP clinics

 
Cube Group


These factors are evolving quickly and in real time. Though not exhaustive, they shed light on some of the key challenges clinics are facing. These challenges are intrinsically linked to others not explicitly mentioned. 

1. Overall, GP activity and the proportion of fees covered by Medicare are decreasing

We wouldn’t consider 2019 – 2023 to be a typical five-year period. The prolonged impacts of COVID-19 pandemic (e.g., shutdowns and vaccination) likely attributed to the sharp increase in GP attendances in mid to late 2021. However, since the peak of COVID-19, the number of GP attendances per person has continued to decrease, falling below pre-pandemic levels.

Exhibit 3. Amongst persons aged 16 – 64, both the number of GP attendances per person and the percent of fees covered by Medicare have continued to decline since late 2021, falling below pre-pandemic levels*

 
*Note: Data includes GP attendances for persons aged 16 – 64 only. GP attendances include: Standard GP attendances, urgent and after-hours GP attendances, GP treatment plans and GP mental health treatment plans, health assessments, and services rendered by a practice nurse or an Aboriginal and Torres Strait Islander health practitioner on behalf of a GP.
Source: Cube Group analysis of Australian Institute of Health and Welfare (AIHW) data


2. GP supply and practicing behaviours are changing

Whilst the number of GPs has increased slightly, the time spent practicing appears to be declining.

Between 2019 and 2023, the number of GPs per 100,000 Australians increased slightly by 0.1% (+0.2 GPs per 100,000). Whilst the growth in GPs is promising, the growth was uneven. New South Wales, Victoria, Tasmania, and the Australian Capital Territory observed growth between 1.1% and 2.7%. Whereas, Queensland, South Australia, Western Australia, and the Northern Territory observed declines between 0.8% and 3.7% 1, 2.

Regardless of the increased number of active GPs, the total effort spent by GPs delivering primacy care declined. GP fulltime equivalent (GP FTE) per 100,000 population declined by 3.7% (4.2 fewer GP FTEs per 100,000 population), with much of the decline occurred in the most recent 12 months data is available for 1, 2.

Exhibit 4. Change in GPs and GP effort per 100,000 population, 2019 to 2023.

 
Source: Cube Group analysis of Department of Health and Aged Care data


Whilst the rising number of GPs against population growth is promising, the recent decline in the number of GP FTEs is of potential concern, especially if the trend continues. This must be monitored and further unpacked to understand what underlying changes in GP practice behaviour and evolving models of care are occurring and why.

3. More GP clinics are accepting new patients

Despite the decrease in GP FTEs, the number of GP clinics accepting new patients across Australia has increased by 380 clinics or 1.4 clinics per 100,000 people from 2022-23 to 2023-24.

On the surface, this is a promising figure and indicative that additional capacity is available for new patients. However, the drivers of this capacity may be less benign, particularly if they are a signal of weakening activity or demand driven by cost-of-living pressures or patients being less willing to engage with traditional primary care.

Exhibit 5. Number of GP clinics accepting new patients per 100,000 population, by State / Territory, 2022-23 and 2023-24 

 
Source: Cube Group analysis of ABS and Cleanbill data


Whilst the change in number of GP clinics accepting new patients (clinic availability) has varied by state / territory, the increase appears to be irrespective of the clinic location’s socio-economic status. On the surface, this is promising as it indicates that clinic availability alone likely isn’t creating an access burden.

However, Exhibit 6 clearly highlights a pre-existing difference between low and high socio-economic areas

Exhibit 6. Number of GP clinics accepting new patients by socio-economic status, 2022-23 and 2023-24

 
Source: Cube Group analysis of Cleanbill data


Low socio-economic status (SEIFA first and second quintiles) has almost half the amount of GP clinics taking new patients compared to areas with high socio-economic status (SEIFA fourth and fifth quintiles). Whilst this raises concern over potential disparity between high and low socio-economic areas, further investigation is required to determine what direct and indirect disparities in fact exist. For example, a lower number of GP clinics accepting new patients may not necessarily result in an increased access barrier.

4. Rising GP clinic operating costs are outpacing funding

As labour, supply, and utility costs have increased for GP clinics over the past year, there has been a 28% decrease in the number of GP clinics bulk bulling standard consultations for non-concession adults.

Exploring impacts to local areas, as defined by ABS statistical areas (SA4), almost 65% of SA4s have less than 20% of GP clinics bulk billing standard consultations for non-concession adults in 2023-24³. This is concerning as Australians most impacted by the ongoing cost-of-living crisis may now also have additional access to barriers due to cost. Whilst the number of GP clinics bulk billing standard consultations has decreased across all socio-economic levels from 2022-23 to 2023-24, the largest decreases occurred in high socio-economic areas (SEIFA fourth and fifth quintiles). Regardless, this raises a deepening concern for certain lower socio-economic areas (SEIFA first and second quintile), including: Mid North Coast NSW (SA4 108), Mandurah WA (SA4 502), Launceston and North East TAS (SA4 602), and West and North West TAS (SA4 604). These four areas observed a 100% decrease in the number of GP clinics bulk billing standard consultations, with the most recent reported average out-of-pocket costs for a standard GP consultation ranging $41 – 53 per visit³. This is potentially leaving those four area’s combined population of approximately 600,000 people at risk of being able to access a GP.

Exhibit 7. Distribution of GP clinics bulk billing standard consultation across Australia and their decline across all SEIFA quintiles


Percent of bulk billing GP clinics by statistical area (SA4), 2023-24

Change in number of bulk billing GP clinics by SEIFA quintile, 2022-23 to 2023-24

Source: Cube Group analysis of Cleanbill data


5. Rising out-of-pocket costs amidst significant cost of living pressures on Australians

From 2022-23 to 2023-24, the average of out-of-pocket cost for a non-concession adult standard consultation (MBS Item 23) increased 3.9% (+$1.52 per visit)³.

Similar to other jurisdictions around the world, Australians are facing significant ongoing cost-of-living pressures. In Australia, 2023 brought high inflation and interest rate hikes, with the per annum increase of the Employee Living Cost Index peaking in June 2023 at +9.6%. All Australians have felt this pressure to some extent, including housing (rising mortgage rates and rentals), food, healthcare, and other areas. The interrelated drivers including economic pressures on GP clinics, changing GP practice behaviour, and decreasing number of bulk billing GP clinics, translates to Australians paying higher out-of-pocket (OOP) costs per visit to see a GP. Whilst a 3.9%, or average of $1.52 per visit, increase may not seem like much, the level of increase varies by area. From 2022-23 to 2023-24, 18 SA4s observed at least a 7% increase in average out-of-pocket cost per visit.

Exhibit 8. Change in average out-of-pocket costs per visit, non-concession adult standard consultations (2022-23 vs 2023-24)


In the 2023-2024 year, only 36% of SA4s pay less than $40 OOP per visit. In the 2022-2023 year, this figure for the same group was 48%.

Source: Cube Group analysis of Cleanbill data


A cause for concern: Largest increases in out-of-pocket costs per visit are in low socio-economic areas

We found that while areas with the highest socio-economic status (fifth SEIFA quintile) continue to have the highest average out-of-pocket costs per visit, the largest increases from 2022-23 to 2023-24 occurred in low socio-economic areas (first and second SEIFA quintiles).

Of even greater concern is that the average out-of-pocket cost per visit in second quintile areas is greater than in the fourth and third quintile areas. This highlights a potential emerging risk for individuals residing in lower socio-economic areas (second SEIFA quintile), and their ability to sustainably afford primary care amidst rising costs.

Exhibit 9. Change in average out-of-pocket costs per visit, non-concession adult standard consultations (2023-24 vs 2022-23) by SA4 SEIFA quintile

 
Source: Cube Group analysis of Cleanbill data


Generally, people in lower socioeconomic groups are at greater risk of poor health, have higher rates of illness and disability, and live shorter lives than people from higher socioeconomic groups. This makes affordable access even more important for these vulnerable individuals. There is a need for this to be monitored closely, especially since seven of the fifteen highest out-of-pocket cost areas have a lower socio-economic status. The activity in these seven areas needs to be further investigated over time to determine if access barriers are worsening, and we must consider the impact on the greater community.

Exhibit 10. Top fifteen statistical areas with the largest average out-of-pocket costs per standard consultation visit

 
Source: Cube Group analysis of Cleanbill, AIHW, ABS data


How can we secure sustainable and affordable access to primary care for all Australians into the future?

As Australians, we should all be concerned about how to secure sustainable and affordable access to primary care into the future.

There is no magic bullet or perfect solution. Addressing the complex and interconnected factors that lead to a lack of sustainability and affordability will require collaboration between policy makers, private practices, universities, health services, and everyday Australians.

Solving this problem is important. Ensuring that every Australian has access to affordable primary care leads to a healthier, happier population and reduces the pressure on our health system.

At Cube Group, we look forward to continuing our work with leaders in the healthcare space to ensure we’re doing our part to create a brighter future for all Australians.


We’re grateful for Cleanbill’s collaboration as we explored this further. As patients ourselves, we understand the importance of the work they do in collecting basic GP background, pricing, availability, location and contact information. Cleanbill makes healthcare information more accessible for all Australians, allowing them to search the healthcare options and costs around them, for free.

For more information and to search for options in your area for free, visit cleanbill.com.au  


1. Australian Department of Health and Aged Care
2. Australian Bureau of Statistics
3. Cleanbill data
Share this article

Content